| Table of Contents |
|---|
Troubleshooting
Why am I not seeing my logs
A: The most common reason is that logs' timestamps are in the future, and this most often happens when timestamps don't specify the timezone. For example, if you are east of UTC (e.g. in +0100 – 1 hour ahead of UTC) and you send logs with timestamps in your local time, but without specifying your local timezone, like this: 2016-01-30T14:00:00.000Z – this timestamp actually represents 14:00 in UTC. However, if it 14:00 in your timezone, which is 1 hour ahead of UTC, that means that 14:00 UTC is actually 1 hours in the future. Currently, Logsene does not display logs that have timestamps in the future, but it does accept them, and shows them when those timestamps stop being in the future.
Another possibility why you are not seeing your logs is that their structure clashes with the structure of your existing logs in the same Logsene app. For example, if you have sent logs with field "priority" as integer field then Logsene will expect all future values of "priority" field to be integers. Sending a string value in a "priority" field will fail. Note that you can change the underlying field "mapping" at any time - see I have multiple different log structures, each with a different set of fields. How should I handle that.
If none of the above turns out to be a problem in your case, please let us know via support@sematext.com or via our live chat!
How to check if there are any network connectivity issues
Things to check to ensure network connectivity is OK:
1. Try to connect to logsene-receiver.sematext.com (port 80 or 443) with the following command:
| Code Block |
|---|
nc -zv -w 20 logsene-receiver.sematext.com 443 |
or if you are using syslog, connect to logsene-receiver-syslog.sematext.com (port 514 for TCP and UDP, port 20514 for RELP, port 10514 for TLS):
| Code Block |
|---|
nc -zv -w 20 logsene-receiver-syslog.sematext.com 10514 |
The output should show something like: Connection to logsene-receiver.sematext.com 443 port [tcp/https] succeeded!
In case you see some other result:
- if your server requires proxy to access the Internet, you'll have to adjust your log shipper config to use proxy settings
- if firewall is used to protect your server, it may be blocking outbound traffic from it. Depending on which receiver and protocol you are using, please ensure with your IT/network admins that right ports are open for outbound traffic
- check your DNS (see below)
2. Check if your DNS has correct entries for Logsene Receiver:
| Code Block |
|---|
nslookup logsene-receiver.sematext.com |
The output of this command should look like this, although the IP addresses and names may be somewhat different, as they change periodically:
| Code Block |
|---|
Server:        127.0.1.1
Address:    127.0.1.1#53

Non-authoritative answer:
logsene-receiver.sematext.com    canonical name = VPC-Logsene-Token-Receiver-LB-188765535.us-east-1.elb.amazonaws.com.
Name:    VPC-Logsene-Token-Receiver-LB-188765535.us-east-1.elb.amazonaws.com
Address: 52.54.165.65
Name:    VPC-Logsene-Token-Receiver-LB-188765535.us-east-1.elb.amazonaws.com
Address: 34.196.180.172 |
Or, if you are using syslog, try:
| Code Block |
|---|
nslookup logsene-receiver-syslog.sematext.com |
The output should be similar to:
| Code Block |
|---|
Server:        127.0.1.1
Address:    127.0.1.1#53

Non-authoritative answer:
logsene-receiver-syslog.sematext.com    canonical name = ec2-52-44-248-43.compute-1.amazonaws.com.
Name:    ec2-52-44-248-43.compute-1.amazonaws.com
Address: 52.44.248.43 |
General
How many logs can I store
A: There is no limit to how many logs you can store in your Logsene app. That said, you should try to pick the ideal Daily Volume when picking your Logsene plan, as that is going to give you the most optimal $/GB price. If you pick too small Daily Volume and often go over the selected volume your $/GB price will be higher than if you picked the next higher Daily Volume.
How can I check the number of logs I currently have in a Logsene app or how many GB/day I am shipping to Logsene
A: From the application, click the App Actions button and select Storage. There's also Settings button next to any of your Logsene applications in the Services > See all Logsene apps. You can also do that from Kibana by searching for all your logs without adding any time filters. The number of hits represents the number of all your logs.
How long are my logs stored
A: How long your logs are stored depends on what Data Retention you selected when you picked your Logsene plan. Each Logsene app can have a different Daily Retention, Daily Volume, and plan. You can change retention, volume, and plan at any time.
Can I send old logs
A: Yes, you can send all logs. However, keep in mind your Logsene app's Data Retention settings. For example, if your retention is set to 7 days and you send logs that are 10 days old (i.e. they contain a timestamp from 10 days ago), they will get accepted, but will get removed shortly after. Thus, check your app's data retention before importing old data.
How can I send old logs
A: Use Logagent. With Logagent you can then do: cat /path/to/old/log | logagent -t YOUR_LOGSENE_APP_TOKEN
Are logs shipped to Logsene ever rejected
A: When you pick a Daily Volume we automatically set another Logsene App property called Max Daily Volume. By default we set it to 2x the selected Daily Volume. When this limit is hit Logsene will stop accepting new logs for that Logsene app until the next day (00:00 UTC). This Max Daily Volume is adjustable, so you can set it to whichever value you'd like. This Max Daily Volume limit prevents run-away logging from causing over-billing. Logsene will send email notifications before this limit is reached.
What is the maximum log size Logsene will accept
A: That depends on the plan you selected for your application. If your application is using the Basic plan, Logsene will accept logs up to 64 KB in size. If your application is using the Standard plan, Logsene will allow logs up to 128 KB. If your application is using the Pro plan, Logsene will accept logs up to 256 KB in size. If your logs are larger than the mentioned limits, please consider using the Enterprise plan.
My logs have special structure. Can Logsene handle that
A: Yes, if the default log index fields (also known as index mapping) don't fit your needs you can create completely custom index mapping. See Custom Logsene Mapping Template How-To.
I have multiple log sources - should I send them all to the same Logsene app
A: Sending logs from multiple log sources to the same Logsene app is not a problem at all. However, if you have multiple different log structures (different "fields" in the logs), see the next FAQ entry.
I have multiple different log structures, each with a different set of fields. How should I handle that
A: If you have N different log structures, the best way to handle that is by creating N Logsene Apps, each with its own index mapping. For example, you may have web server logs, your system logs in /var/log/messages, and your custom application logs. Each of these 3 types of logs has a different structure. The web server logs probably use Apache Common Log format, the logs in /var/log/messages have syslog structure, and your own application's logs can be in any format your application happens to use. To handle all 3 log formats elegantly simply create 3 separate Logsene Apps and use a different format for each of them. If you want to be able to search all logs together, even when they have different fields, you can do that - just ship them all to the same Logsene App. The thing to watch out for are fields that have the same name, but different data type. For example, if one log source has a purely numeric field "size" and another log source also has a field "size", but can have non-numeric values, this will cause issues. Thus, either keep logs of different structures in separate Logsene Apps or make sure there are no conflicting fields.
Plans & Prices
How much does Logsene cost
A: Check the Logsene Plans & Prices table.
What happens with my logs when I change from the free to a paid plan or vice versa
A: You don't have to worry about your data when you switch from the free plan to a paid one. Your logs will remain safe and you can still be able to search them. Your data will remain accessible based on your data retention settings. However, when you move from a paid plan to a free plan, free plan restrictions will be applied to your data, which including data retention, too.
What is data retention and how does it work
A: Data retention mechanism is responsible for removing old log events. If a log is 15 days old and you have retention set to 7 days, that log will remain in Logsene until the retention mechanism deletes it. For paid plans we remove whole 24-hour periods once a day. For free plans we remove old data every 30 minutes.
Is data retention based on index/import/upload time or the actual log event @timestamp
A: Data retention is based on log event @timestamp. Logsene app's retention removes data whose @timestamp is older than the retention setting.
What happens if I go over the selected daily log volume and how much does that cost
A: The GB/day volume is not a limit. That number controls only cost per GB. When you go over the GB/day number you had selected we do not reject your data (for protection, use Max Daily Volume). Instead, we keep track of how much data over the selected daily volume was shipped and add that to the monthly cost using the $/GB rate for the selected daily volume. The higher daily volume you select, the lower the per GB price. For example, if you picked 1 GB/day and you typically don't go over it, or go over very little, then it pays to keep that 1 GB/day selection. However, if you ship closer to 5 GB/day, then you should select 5 GB/day volume, because that will give you a lower $/GB rate than if you stay with 1 GB/day selection.
Security
Can I ship data to Logsene using a secure and encrypted transport like TLS/SSL or HTTPS
A: Yes, all data can be shipped both over encrypted channels like TLS/SSL and HTTPS, or via their unencrypted counter-parts. See https://apps.sematext.com/logsene-reports/client.do for more information about how to configure log shipping.
How secure is my data
Logsene runs on Amazon AWS, whose infrastructure follows IT security best practices and adheres to a number of compliance standards such as SOC 1/SSAE, SOC 2, SOC 3,16/ISAE 3402 (formerly SAS 70 Type II), FISMA, DIACAP, FedRAMP, and HIPAA. For more information about AWS security and compliance certifications see: http://aws.amazon.com/security and https://aws.amazon.com/compliance/.
Where is my data stored
Logsene runs and stores data in Amazon AWS in the US.
How long is my data stored
This depends on the data retention you selected for each of your Logsene apps. Backups are stored in S3 and kept for 90 days.
Kibana
Can I use my own Kibana 4
A: Yes. Please see How to use Kibana 4 with Logsene Log Management.
How can I get a nice map of the world in Kibana
Like this:
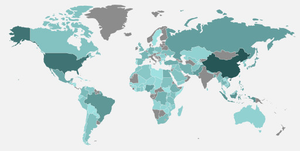
A: In Kibana itself, you need to add a new map panel. In the panel's settings, you need to specify a field from your logs to be used to build the map. That field has to contain a country code.
If you don't have a country field in your logs, but you have an IP, you can use Logstash's geoip filter. For example, a configuration like this:
| Code Block | ||||
|---|---|---|---|---|
| ||||
input {
  stdin {
    type => "human"
  }
}
filter {
  geoip {
    source => "message"
  }
}
output {
  elasticsearch_http {
          host => "logsene-receiver.sematext.com"
          port => 80
          index => "YOUR-APPLICATION-TOKEN-GOES-HERE"
  }
} |
...
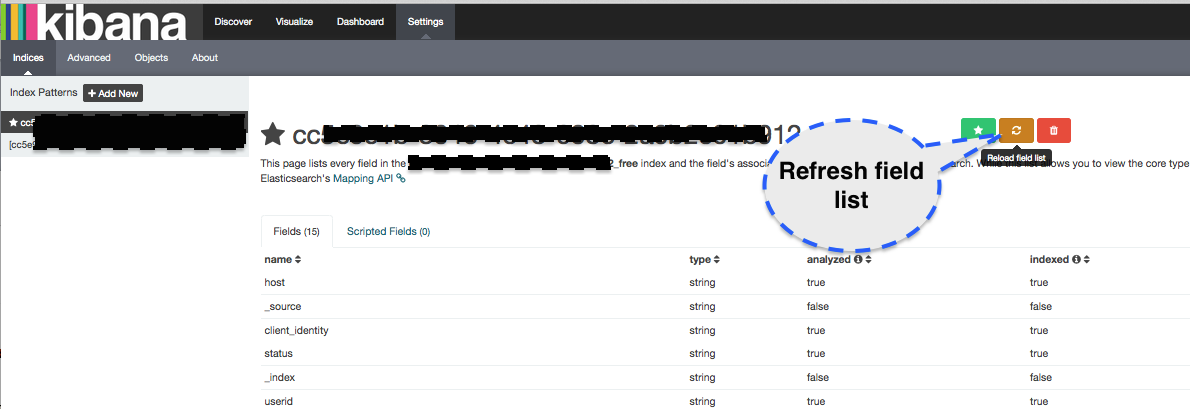
Why are new fields not visible in Kibana 4 and how do I fix it
Kibana 4 doesn't update field lists automatically. This problem is not specific to Logsene, but is a general Kibana issue. If you add new fields to an index you must navigate to 'Settings / Index' in Kibana and refresh the fields using the refresh button as shown in the screenshot below. The new fields will appear and will be ready to use in your visualizations and searches.
Can I run Kibana 4 locally and point it to Logsene
Yes. If you prefer to run Kibana locally (e.g., on your laptop or one of your company's servers) and point it to Logsene, yes, you can do that - see How to use Kibana 4 with Logsene.
How do I create a dashboard in Kibana 4
Kibana 4 requires the following high level steps to create a dashboard:
- Create a visualization - click to 'Visualize' and save it when finished. See also: https://www.elastic.co/guide/en/kibana/current/visualize.html
- Create a "Search" in the Discover view and save it. Once you do that you can add it as table to your Dashboard later (See screenshot "Log View"). See also: https://www.elastic.co/guide/en/kibana/current/discover.html
- Go to the Dashboard view and add the saved visualizations to it. See also: https://www.elastic.co/guide/en/kibana/current/dashboard.html
- Save the Dashboard
Why I cannot draw charts (dashboards) using a given field
By default all string values sent to Logsene are analyzed. For each analyzed fields we also create .raw field which is not analyzed. If you want to use string field for drawing charts you should either use .raw field or change index templates to use not_analyzed type (https://sematext.com/blog/2015/01/20/custom-elasticsearch-index-templates-in-logsene/). Let's consider and example. We have a field called 'title'. Logsene uses this field as analyzed one so it is not possible to use it in dashboards. Logsene also creates automatically a field called 'title.raw' and this one can be used for charts.
Timestamps
Why does my syslog timestamp have a different time zone
A: The original syslog specification (RFC 3164) has a date field that doesn't contain any time zone information. Fortunately, there's a new specification (RFC 5424) that uses ISO 8601 timestamp. That's why we recommend using the new format for syslog daemons that support it, such as rsyslog or syslog-ng. If you use an older syslogd implementation, or you simply prefer to use the older format, you have two options to have a correct timestamp:
- set the system time on your server to UTC, or
- change the timestamp for your logs to ISO 8601. For example, rsyslog does it with the default template RSYSLOG_ForwardFormat. For instance, to forward all logs via TCP, with the original specification, but with the ISO timestamp, you'd add the following line to your config:
*.* @@logsene-receiver-syslog.sematext.com:514;RSYSLOG_ForwardFormatWhat are the supported timestamp formats
If you send your logs via the Elasticsearch API, you can use:
- ISO8601. For example, 2001-06-08T08:00:01.123Z or 2001-06-08T08:00:01+03:00. A timezone must be there after the time (use Z for UTC), so 2001-06-08T08:00:01.123 won't work. You can also send timestamps with just the date (2001-06-08), and we'll count them as occurring at 00:00
- UNIX time in milliseconds, for example 1487854172123. UTC is assumed here, so we recommend setting the system time to UTC if you go this route
If you send your logs via syslog, you can use ISO8601, too (recommended, see the previous question) or the legacy RFC-3164 timestamp (like Oct 11 22:14:15). The legacy format assumes UTC and assumes the current year. It doesn't have sub-second precision, either.
See Supported Date Formats for more examples of supported date and time formats.
What happens if I try to send data with @timestamp older than my retention time
A: You can send old logs. However, keep in mind your Logsene app's retention settings. For example, if your retention is set to 7 days and you send logs that are 10 days old (i.e. they contain a timestamp from 10 days ago), they will get accepted and processed, but will get removed within the next 24 hours.
What happens if I try to send data with @timestamp that is in the future
A: You can send logs with timestamps in the future, but they will not be shown in Logsene until their timestamps stops being in the future. For example, if you send logs that are "2 hours ahead of real time" they will be accepted, but will not be displayed until 2 hours later.
Log Shipping
Which log shippers, logging libraries, and platform integrations are supported
A: You can use numerous log shippers, logging libraries, and platform integrations.
How can I import logs from an existing Elasticsearch / ELK stack system
A: You can use elk2logsene to do that or even just Logstash - see Elastic Stack Import-Export with Logstash & Logsene.
How can I ship logs from Android and iOS apps
A: For shipping logs from Android apps use https://github.com/sematext/sematext-logsene-android and for shipping logs from iOS apps use https://github.com/sematext/sematext-logsene-ios.
How can I ship AWS CloudTrail logs, AWS VPC logs, and other logs from S3
A: Use the https://github.com/sematext/logsene-aws-lambda-cloudwatch AWS Lambda function. See Forwarding CloudTrail or Other Logs from AWS S3 to Logsene and Sending AWS Cloudwatch Logs to Logsene for detailed description of how to do this.
Why is it that I can forward logs with rsyslog via TCP or UDP, but not via RELP
A: You probably need to install the omrelp module first. If you have rsyslog installed in your system, there's probably a package that you can install:
For RedHat and CentOS:
% yum install rsyslog-relpFor Debian and Ubuntu:
% apt-get install rsyslog-relpFor SUSE and OpenSUSE:
% zypper install rsyslog-module-relpIf you compiled rsyslog manually, you need to supply --enable-relp to the configure script. You can check if rsyslog starts properly by starting it in foreground:
% rsyslogd -nYou will get an error if the module is not found or you have any other problem. For debug mode, add -d as well.
How do I ship exception stack traces and other multi-line logs with Logstash without breaking them into multiple log events
A: Please see Handling Stack Traces with Logstash.
Logsene Alerts
What are Logsene Alerts
A: Logsene alerts are based on saved searches that trigger alert notifications when these saved searches meet a certain threshold condition in your logs - e.g. less than N matches in 5 minutes, more than M matches in 3 minutes, etc., or when such saved searches detect sudden changes in the number/volume of matching logs - i.e., anomalies.
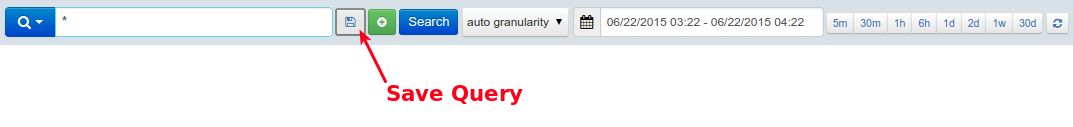
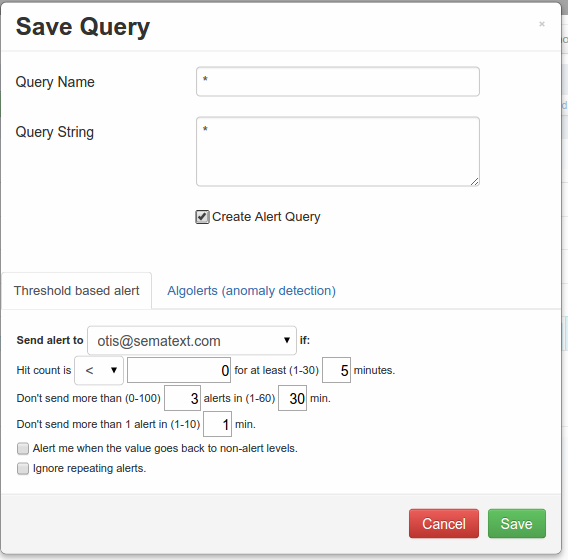
How to create Logsene Alerts
A: Logsene Alerts are added by clicking the disk icon on the right side of the search box. Please see screenshots below.
How to view Logsene Alerts
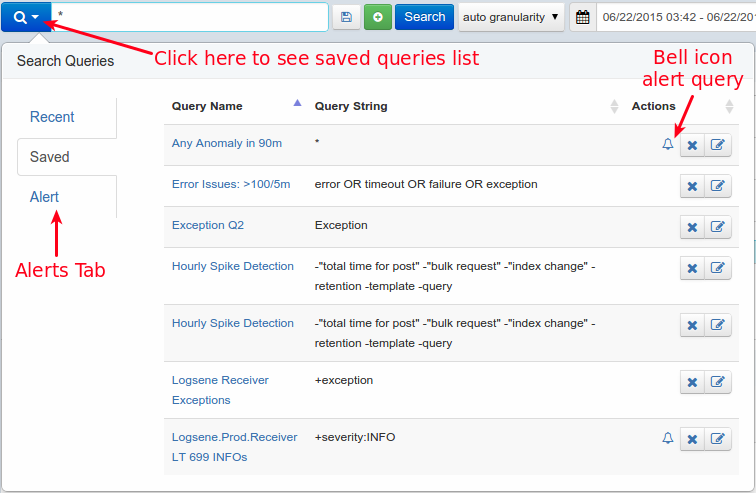
A: All saved queries are listed in "Search Queries" modal because all Alert Queries are also Saved Queries. To view this modal just click a magnifying glass icon left of the search field. Alert Queries are marked with bell icon on "Saved" tab. If you want to see only Alert Queries choose the "Alert" tab.
What is the difference between threshold-based Alerts and Anomaly Detection (aka Algolerts)
A: If you have a clear idea about how many logs should be matching a given Alert Query, then simply use threshold-based Alerts. In other words, if you know that you always have some ERROR-level log events, you may want to use threshold-based alerts for that. For example, if your logs typically have < 100 ERROR-level messages per minute you may want to create an Alert Query that matches ERROR log events and notifies you when there are more than 100 such matches in 1 minute.
If you do not have a sense of how many matches a given Alert Query matches on a regular bases, but you want to watch out for sudden changes in volume, whether dips or spikes, use Algolerts (Anomaly Detection-based Alerts). An extreme example that you may actually like is an Alert Query that matches all logs - "*" - a single wildcard character for a query. If you use that for an Algolert then Logsene will notify you when the overall volume of your logs suddenly changes, which may be a signal that you should look for what suddenly increased logging (e.g. maybe something started logging lots of errors, exceptions, timeouts, or some such), or why logging volume suddenly dropped (e.g. maybe some of your server(s) or app(s) stopped working and sending logs).
Can I send Alerts to HipChat, Slack, Nagios, or other WebHooks
S3 Archiving
How to obtain credentials from AWS
A: For Logsene AWS S3 Settings, besides S3 bucket name, you'll need Access Key ID and Secret Access Key.
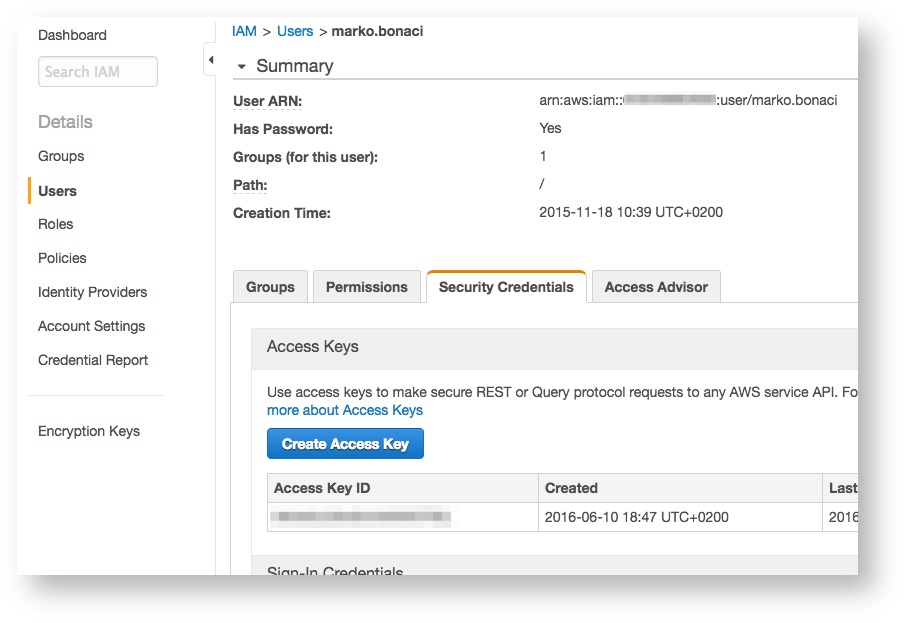
Log in to your AWS account, go to IAM > Users and open (or create) a user that you want to use for S3 uploads:
Click on Create Access Key:
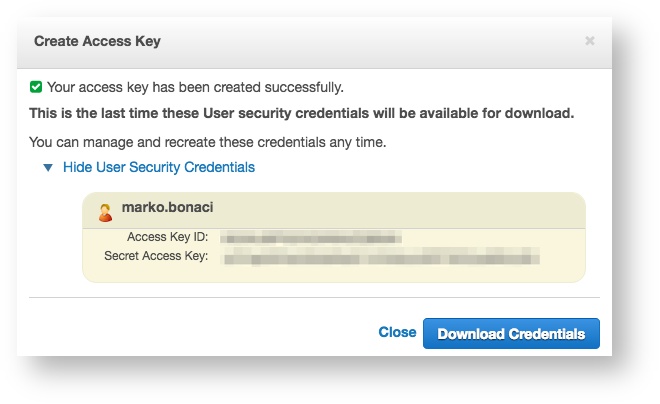
Note down Access Key ID and Secret Access Key (you can Download Credentials to a safe place if you like, but it's not necessary).
How to setup S3 archiving for your Logsene app:
A: In Sematext web app, go to Integrations > Apps view and choose Configure S3 using row context menu (three-dots icon) of the app whose logs you want to ship to S3:
...
Paste Access key ID and Secret access key to the corresponding fields.
Enter Bucket name (just the simple name, not fully qualified ARN) and choose Compression (read on for more details about compression) and confirm with Verify and save.
At this point, Logsene is going to check whether the information is valid using the AWS S3 API.
After the check is done you'll see a feedback message confirming information validity or an error message.
Which credentials are required when using AWS S3 Bucket Access Policy
A: In order to verify access to your S3 bucket, Logsene will first use the credentials to log in and, if successful, it will proceed to create a dummy object inside the bucket.
If object creation was successful it will delete the object.
For those reasons, the following credentials must be given to the bucket when saving AWS S3 settings:
s3:GetObjects3:PutObjects3:DeleteObject
After the verification is done you can remove s3:DeleteObject permission from the bucket policy.
How are logs compressed in S3
A: You have the option of choosing between two modern, lossless compression codecs from the LZ77 family, with excellent speed/compression ratio, LZ4 and LZF.
If you choose No compression option, logs will be stored in raw, uncompressed format, as JSON files.
How can I decompress logs archived in S3
A: You can decompress by installing these command line programs (then use man lz4 or man lzf for further instructions):
Ubuntu/Debian:sudo apt-get install liblz4-toolsudo apt-get install libcompress-lzf-java (landed in Ubuntu 15.04)
OSX:brew install lz4brew install liblzf
Which folder structure Logsene uses when uploading logs to S3
A: Inside a bucket that you specify in settings, the following folder hierarchy is created:
sematext_[app-token-start]/[year]/[month]/[day]/[hour]
Where [app-token-start] is the first sequence of app's token.
E.g. for app with token f333a7d7-ab55-4ce9-94a5-cdb44a704740, folder will have the following path on May 01, 2017 at 11:20PM UTC:
sematext_f333a7d7/2017/05/01/23/
![]() Note:
Note:
Before May 01, 2017 the folder hierarchy was more flat:
/<tokenMD5HexHash>/logsene_<date>/<hour>
...
Documentation moved to https://sematext.com/docs/logs/faq/